Employee recognition
How to Measure Employee Recognition (Without the Vanity Metrics)
Explore step-by-step methods, metrics, and tools backed by real case studies to improve engagement and track measurable business impact.
How to measure the ROI of your employee recognition program using Stadium.
Employee recognition isn’t just a feel-good HR initiative—it’s a strategic driver of retention, engagement, and performance.Â
Research by Deloitte shows that organizations invest $46 billion yearly in recognition programs, yet fewer than 22% can prove their investment return effectively.
Your recognition program is running. Whether it’s actually working is a different question. Leadership will ask. “Engagement feels better” is not an answer that survives a budget review.
Unmeasured programs are the first to get cut when budgets tighten–and the first to quietly fail when something’s wrong inside the data.
This guide gives you the full KPI framework, the 7-step measurement system, and the benchmarks you can put in front of your CFO. By the end, you’ll know what to track, how to track it, and how to prove the program is shifting engagement, retention, and the numbers finance cares about.
Why Measuring Your Recognition and Rewards Program Is a Must
1. The defensibility problem
A recognition program with no measurement layer is operationally invisible.
It’s running, but nobody outside the HR team can see what it’s doing–and that becomes a problem the first time the CFO asks for the number behind it.
“People seem happier” doesn’t survive the next budget review. “Voluntary turnover dropped 4 points and reach is at 87%” does.
That pressure is real. Gallup’s 2024 engagement data shows only 31% of U.S. employees are engaged–a 10-year low.
Leadership wants to see what HR is doing about it. Recognition is an obvious answer, but only if you can prove the numbers behind it.
Measurement is what turns recognition from a nice-to-have into a line item leadership funds without flinching.
The HR team that builds the measurement layer first usually wins the next budget cycle.
2. Financial accountability:
Limited financial resources require HR initiatives to demonstrate their monetary benefits.Â
When employee recognition programs base their rewards on lowered employee turnover and superior performance metrics, the data proves the financial return on investment.Â
Organizations that track program success through metrics reveal cost reduction and productivity enhancement, which helps maintain financial backing.
3. Program optimization:Â
Every method used for program optimization does not create equivalent outcomes. Evaluating the effects of recognition on employee engagement helps organizations develop better recognition strategies.Â
Organizations gain insights into what recognition methods produce the best employee participation and improve team morale through data analysis of peer-to-peer shout-outs, leader-led appreciation, and milestone achievements.Â
The recognition platform [insert platform name] enables businesses to identify underperforming aspects, which helps organizations enhance their recognition procedures.
4. Employee expectations:Â
The present-day workforce expects timely and purposeful recognition directly related to their work.Â
Your recognition platform helps record employee preferences, allowing you to give tailored rewards that increase satisfaction throughout different departments. Recognizing employees in methods that connect with them results in higher program effectiveness.
5. Cultural alignment:Â
Companies should use recognition programs as powerful tools to strengthen their company values through cultural alignment.Â
Reviewing episodes where behaviors and values repeatedly appear enables you to discover organizational strengths and resolve weak areas. Analyzing this information leads to the development of an improved workplace culture.
6. Leadership buy-in:
Top executives will better support recognition programs when data demonstrates their value.Â
Business accomplishments such as net promoter score improvements, combined with increased retention rates and enhanced employee performance, give recognition strategies status as a fundamental management priority.
To ensure the success of your program, use clear metrics to measure and a robust recognition platform to track progress. Recognition is not just about good intentions but about measurable impact.
The 7-Step Framework to Set Up Your Recognition Measurement System
Step 1: Define Recognition Objectives and KPIs
🎯 What to Do:
Start by clarifying what success means for your recognition program:
Reduce employee turnover
Improve employee engagement
Increase team productivity
Boost eNPS (Employee Net Promoter Score)
Set baseline metrics before launching your recognition program so that you have comparison data later.
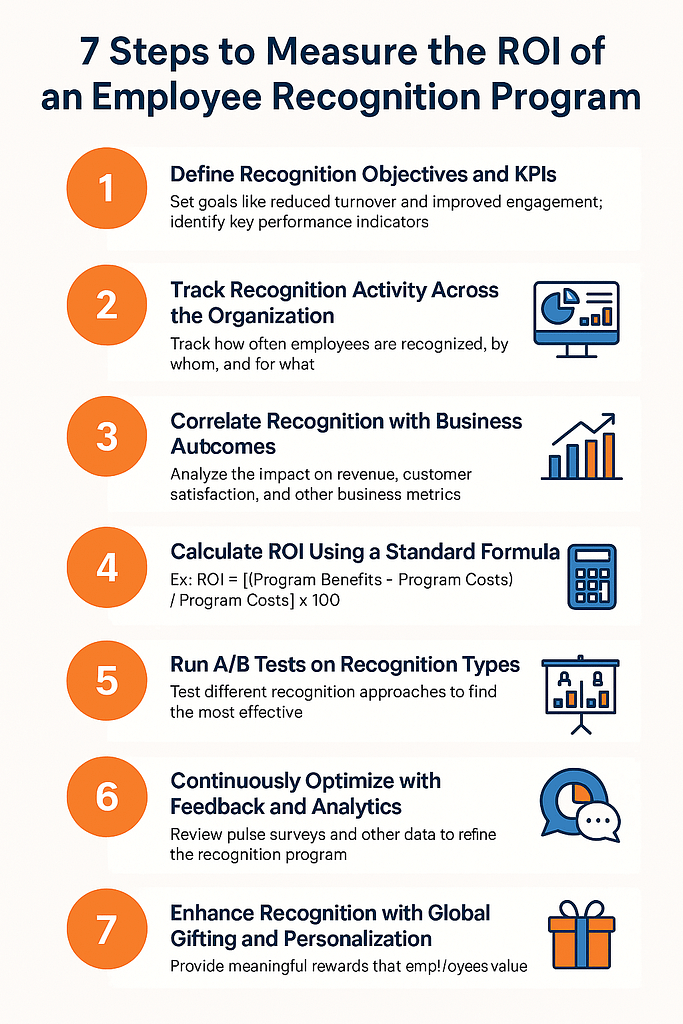
Stadium lets you define and track custom KPIs right within your recognition campaigns. You can:
Measure eNPS changes before and after recognition events
Use pulse surveys to gauge how employees feel about recognition
Monitor recognition frequency and track improvements over time
Step 2: Track Recognition Activity Across the Organization
🎯 What to Do:
Tracking how often employees are recognized—and by whom—for what types of actions helps answer several key questions:
Are certain teams or individuals being overlooked?
Is recognition happening consistently, or only during performance reviews?
Are recognitions aligned with company values or goals?
Why it’s challenging: Without a structured system, recognition often becomes informal and untracked. It might be verbal or hidden in Slack messages, making it difficult to evaluate its true reach and impact.
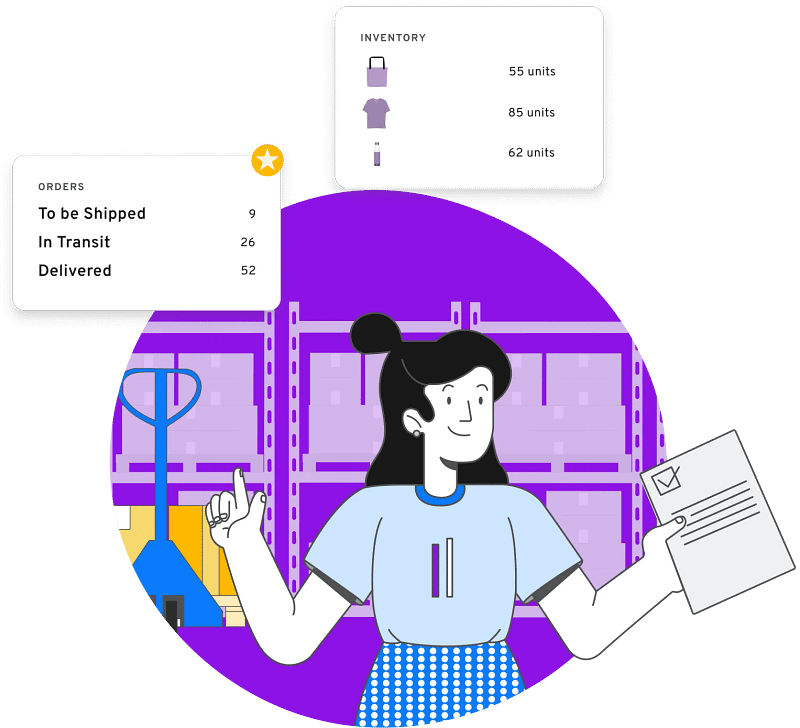
Stadium’s real-time dashboards and heat maps offer complete visibility:
View recognition by team, department, or geography
Identify under-recognized groups (e.g., night shifts or remote workers)
Monitor types of recognition: peer-to-peer, top-down, and value-tagged
Step 3: Correlate Recognition with Business Outcomes
🎯 What to Do:
This step connects the dots between recognition and tangible business metrics like:
Revenue: For example, do recognized sales teams close more deals?
Customer Satisfaction: Do service teams receiving kudos perform better on CSAT surveys?
Project Delivery Speed: Are highly recognized teams completing work faster?
Why it’s important: Recognition should lead to behaviors that impact business success. If employees feel valued, they’re more engaged—and engaged employees drive better results.
Value-tagging links recognition to strategic outcomes (e.g., "Innovation", "Customer Focus")
Recognition trends can be matched with team-specific metrics such as Net Revenue Retention or CSAT scores
Step 4: Calculate ROI Using a Standard Formula
Use this formula:
ROI = [(Total Program Benefits - Total Program Costs) / Total Program Costs] x 100
Let me apply in Example:
Let’s say your 200-person company launched a recognition program.
Turnover dropped from 20% to 15%. Average replacement cost: $30,000.
You saved 10 employees x $30,000 = $300,000.
Program cost (platform, rewards, admin): $75,000.
ROI = [(300,000 - 75,000) / 75,000] Ă— 100 = 300% ROI
But what are those benefits and how can you calculate them?
🔍 Estimating Program Benefits:
Savings from reduced turnover:
Identify turnover rate before and after recognition program.
Multiply difference by average replacement cost per employee (typically 50–200% of annual salary).
Revenue from increased productivity:
Track performance metrics (e.g., project delivery time, sales numbers).
Estimate monetary value of increased output.
Reduced absenteeism:
Compare sick days before and after implementation.
Calculate savings based on average cost per absence.
Improved hiring metrics:
Track time-to-fill and cost-per-hire.
Improved eNPS typically correlates with stronger talent pipelines.
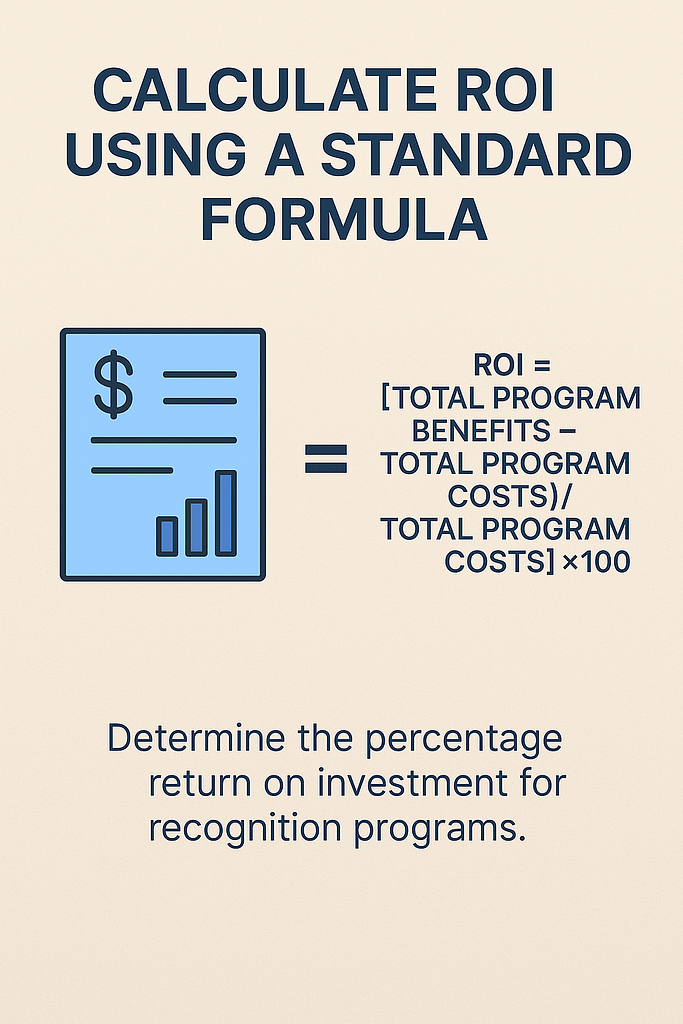
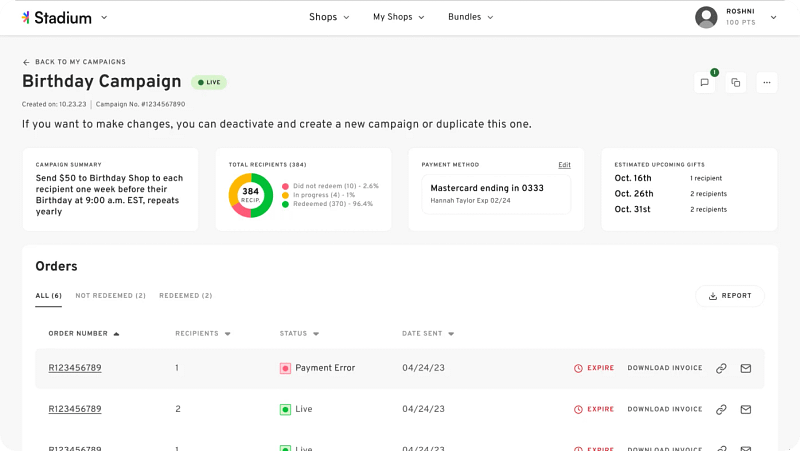
Stadium provides automated ROI reports, showing your benefit-to-cost ratio in a dashboard. These reports pull from actual campaign data—so you’re not guessing.
Step 5: Run A/B Tests on Recognition Types
🎯 What to Do:
Don’t assume one-size-fits-all. Test different recognition strategies:
Public shoutouts vs. private notes
Gift cards vs. swag
Peer-to-peer vs. manager recognition
Track performance, engagement, and sentiment data across each test group.
Why it matters: Different teams or personalities respond differently. A/B testing allows for data-backed optimization.
Segment campaigns based on recognition type
Analyze response rates, productivity, and survey data across each group
Step 6: Continuously Optimize with Feedback and Analytics
🎯 What to Do:
Recognize that what works today might not work tomorrow. Collect regular feedback and iterate.
Run monthly pulse surveys post-recognition
Host feedback sessions with team leads
Monitor campaign participation rates
Why it matters: Employee needs evolve. Keeping a feedback loop ensures your program stays relevant and impactful.
Launch pulse surveys within campaigns
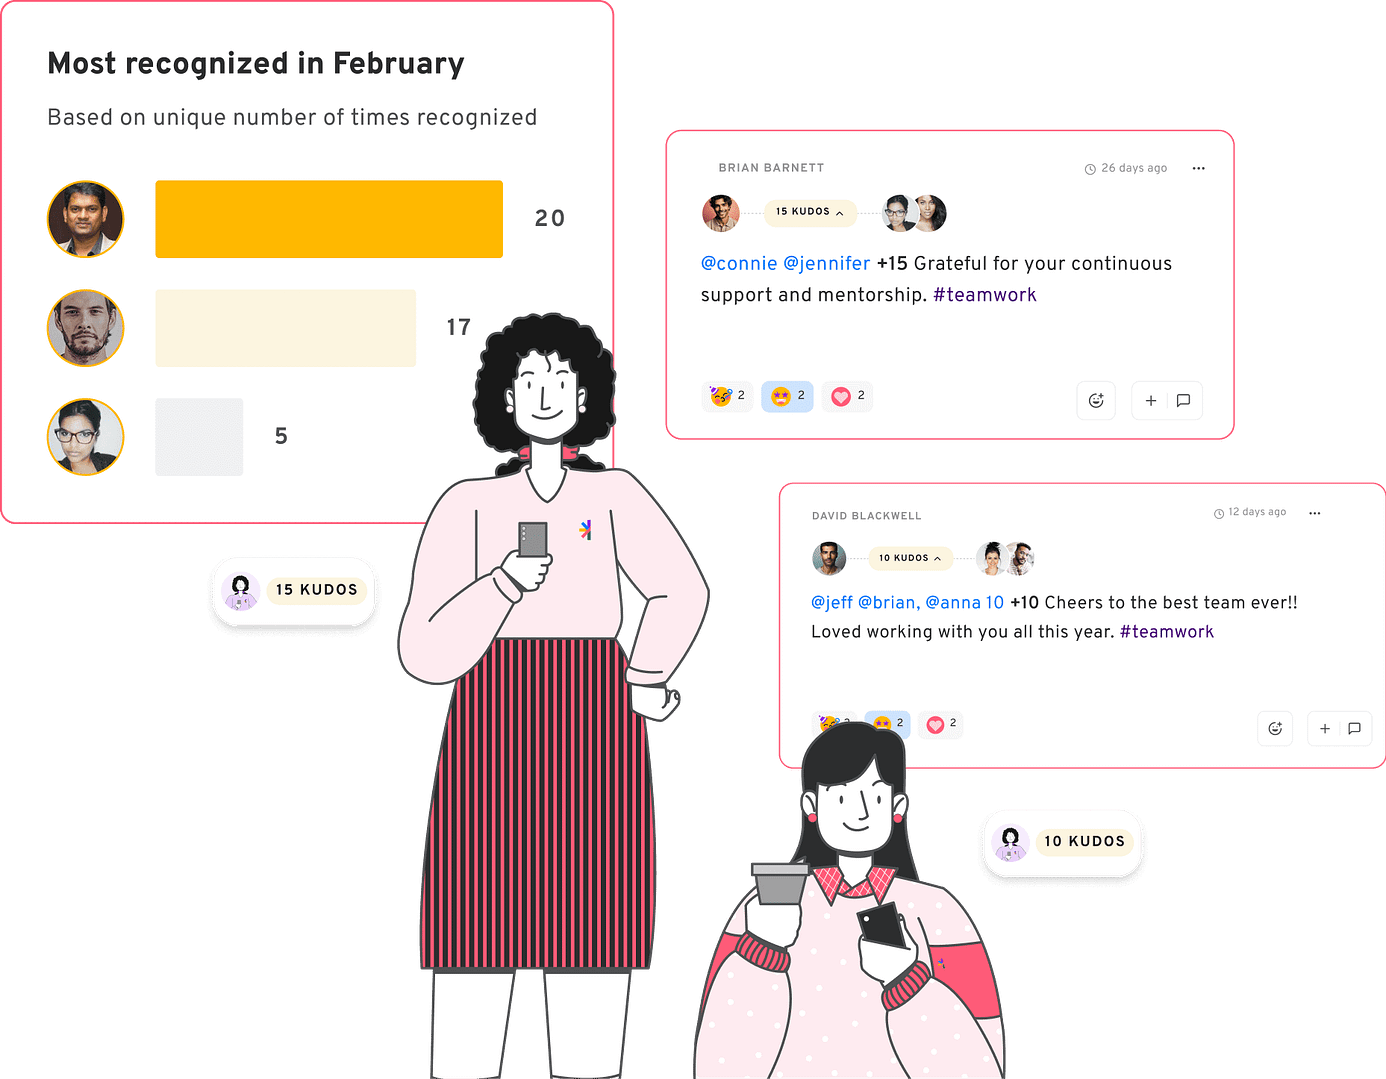
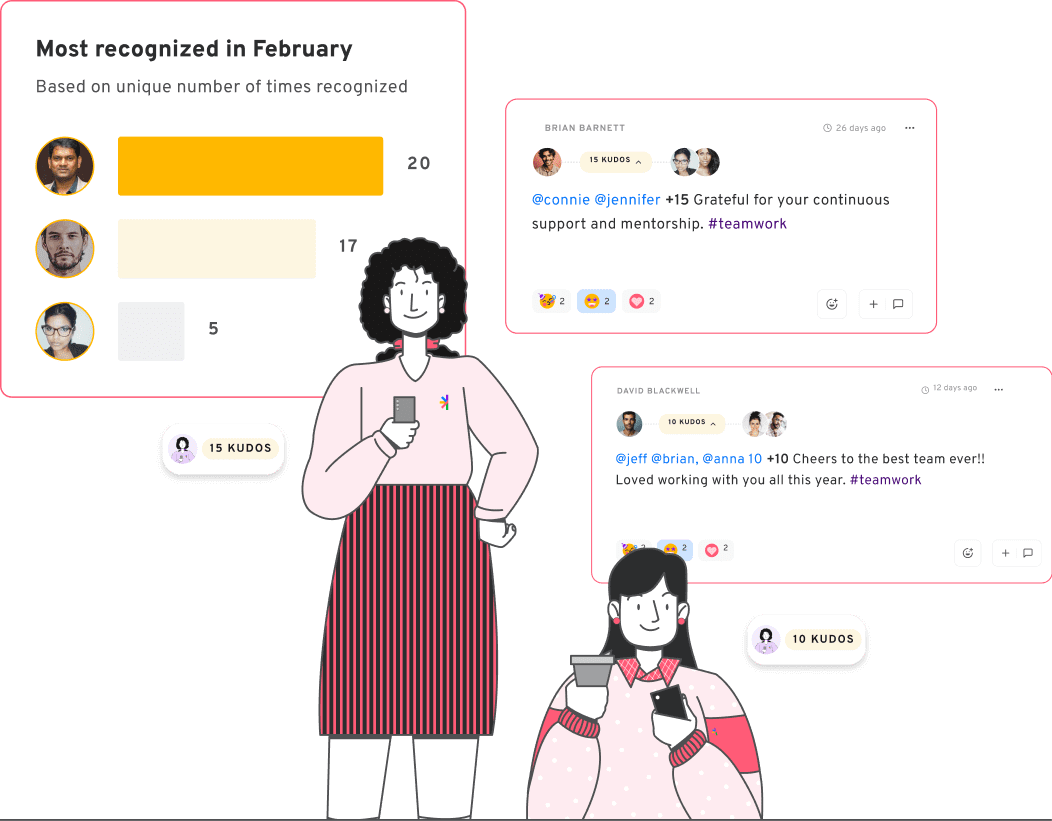
Use Insights Dashboard to see trending hashtags, most recognized teams, and behavioral patterns
Step 7: Enhance Recognition with Global Gifting and Personalization
🎯 What to Do:
One of the biggest mistakes is giving rewards that don’t resonate. Give employees meaningful choices.
Let them pick between gifts, experiences, swag, or monetary awards
Customize options for global employees to ensure fairness and relevance
Why it matters: A gift card that works in New York might not in Singapore. Recognition loses its value if it feels forced or irrelevant.
Global delivery network in 170+ countries
Custom branded shops for companies
The 5 Categories of Recognition KPIs Every HR Leader Should Track
The five categories of recognition KPIs are program usage, equity and distribution, recognition criteria, engagement and retention impact, and business outcomes. Together they answer the questions that matter: Is recognition happening? Is it fair? Is it reinforcing the behaviors the company actually wants? Do employees feel it? And does any of this show up in retention or revenue?
You don’t need every metric in every category. Pick one per category, track it consistently, and put a baseline behind it. That’s the dashboard.
Program Usage and Adoption Metrics
The base layer of measurement. Six metrics worth tracking:
Â
- Recognition frequency – how often recognition is sent per week or month.
- Recognition reach – the percentage of employees who receive recognition in a given period (target: 100% on a quarterly basis).
- Sender participation rate – the percentage of employees who give recognition, not just receive it.
- Manager participation rate – manager-led recognition is the single highest-impact recognition source, per Gallup-Workhuman 2024 research.
- Award redemption rate – for points-based programs, the percentage of awarded points actually redeemed.
- Time-to-fulfillment – how long it takes for a recognition moment to actually land (gift delivered, snack box arrived, gift card redeemed).
Â
That last one tends to get skipped. Recognition that never reaches the recipient isn't recognition–it's a notification. And reach is where most programs quietly fail: only one in three U.S. workers strongly agree they received recognition in the past seven days, per Gallup. That's the reach problem in one number. Participation alone won't show you that.
Â
Stadium's Shop Dashboard surfaces frequency, reach, sender participation, and redemption in one view. Time-to-fulfillment is the Stadium-specific KPI: because recognition is fulfilled locally in 170+ countries, the moment is measurable end-to-end–not just at the digital ping.
Â
Frequency without reach is theatre. Both must move together.
Equity and Distribution Metrics
The single most-skipped category. Recognition that goes to the same five people every quarter is not recognition–it's favoritism with a dashboard. Four metrics:
Â
- Recognition by department – does one team get 60% of all kudos while another gets 5%?
- Recognition by tenure – are new hires invisible?
- Recognition by role level – are frontline, hourly, and non-desk workers getting recognized at the same rate as knowledge workers?
- Recognition by demographic and geography – does the program reach equally across gender, race, country, and time zone?
Â
Run this analysis quarterly. Use the data to coach managers in under-recognizing teams. Stadium's Workspace breaks recognition distribution by team, region, role, and tenure natively–part of how the platform scales from 1 sender to 1,000+ without losing the equity view.
Â
Equity is not a value statement. It's a quarterly metric.
Recognition Criteria Metrics
Two recognition programs can have identical participation rates and reach–and totally different outcomes–because they recognize different things. Categorize recognition by what it's reinforcing:
Â
- Performance-linked – KPIs hit, projects delivered.
- Behavior-linked – collaboration, problem-solving, leadership at any level.
- Values-linked – the percentage of recognitions tagged to a stated company value.
- Milestone-linked – anniversaries, tenure, promotions, growth moments.
Â
Then track the mix. If 95% of recognition is values-linked and 5% is performance-linked, the program is reinforcing the wrong things for a high-growth business. The mix is the metric.
Â
Stadium's kudos program supports tagging–hashtags tied to company values, performance categories, milestones–so the mix becomes visible by default. Keyfactor renamed kudos to KEYkudos and tagged them with company values; the full case study lives further down.
Â
Two programs can look identical in the dashboard and reinforce two different cultures.
Engagement and Retention Impact Metrics
This is the category that gives the program defensibility in a leadership review. Four metrics worth tracking:
Â
- eNPS movement – how the Net Promoter Score for the company as an employer changes after recognition launches.
- Engagement survey scores on recognition-specific questions – the "I receive meaningful recognition for my work" line item.
- Voluntary turnover rate – measured at company, business unit, and team level so isolated impacts can be seen.
- Tenure trends – well-recognized employees stay measurably longer.
Â
The retention case for recognition is now well documented. Gallup-Workhuman's 2024 research found well-recognized employees were 45% less likely to have turned over two years later.
Â
Pair these with Category 1 usage data. Business units with higher recognition reach should show better engagement and retention movement. Stadium connects the two layers through 100+ integrations (UKG, Workday, BambooHR, and others), so recognition data sits next to retention data instead of stranded in a separate vendor's portal.
Â
Recognition data without retention data is half the picture. Connect them.
Business Outcome Metrics
This is the category that earns the program its next budget. Four metrics worth picking from:
Â
- Cost-of-turnover saved – turnover cost (a conservative rule of thumb is 33% of salary, per the Work Institute) multiplied by the number of avoided departures attributable to the program.
- Productivity correlation – recognition reach by team paired with team-level productivity or output metrics.
- Customer satisfaction movement – recognized employees deliver better customer outcomes.
- Vendor consolidation savings – for enterprises consolidating recognition, swag, snack boxes, and gifting into one platform, the eliminated vendor count is a real annual savings figure leadership cares about.
Â
Pick one of these four. Report it quarterly.
Â
Vendor consolidation is the Stadium-specific business outcome metric. Most competitors cover the first three. Stadium covers the fourth because Stadium is recognition, swag, snack boxes, and gifting on one platform–with 1 to 1,000+ scale, 25,000+ products, and 100+ integrations behind it.
Â
"We cut 9 vendors, saved a ton of money, and took our engagement to an all-new level." – Nish P, CEO at Paperchase
Â
Recognition consolidates more than just kudos. It consolidates vendor sprawl.
How Stadium Makes Recognition Measurement Effortless
One platform, five measurement categories, every region
Stadium’s measurement surface maps to the five KPI categories one-to-one.
- Workspace pulls usage, equity, criteria, engagement signals, and business outcomes into a single view.
- Shop Dashboard handles participation, reach, and redemption.
- Automation Dashboard handles milestone fulfillment.
- With 100+ integrations, recognition data sits next to the HRIS, so retention and engagement metrics layer in without a second tool.
- And because Stadium fulfills locally in 170+ countries, geographic equity becomes a real metric–not a wish.
Recognition, swag, snack boxes, and gifting run from one platform–which means the whole measurement story lives in one dashboard, not five. That’s why 10,000+ companies trust Stadium to run their recognition programs from 1 sender to 1,000+, on a platform built for both the HR team of one and the enterprise rolling out across 50 business units.
Five categories, one platform. The measurement story isn’t five vendors deep–it’s one.
- Peer-to-peer, senior-to-junior, and vice versa
- Assign monetary value to kudos or keep them free
- Integrate with Teams, Slack, or use our platform
- 1M+ gifts from top brands + customizable swag
- Enable kudos to flow freely across your org chart
Are you ready
to take recognition to a whole new level?