Stadium for Employee Engagement
Calculate employee engagement ROI with a simple formula and worked example, track it with the right KPIs, and learn the fastest lever to move the number.
Employee Engagement is easy to defend in a meeting.
It’s hard to defend in a budget.
Every HR leader knows engaged people stay longer, work harder, and drag fewer problems into the building.
But the moment you ask finance to fund a recognition program, the conversation changes.
“People feel more appreciated” doesn’t survive a budget review.
A number does.
This guide gives you the number.
Before that, if you’re still working out how to measure employee engagement in the first place, start there–this piece picks up where measurement ends, turning those metrics into a dollar figure.
Coming back to this guide, you’ll get the exact ROI formula, a worked example you can copy with your own headcount, the KPIs that actually feed the calculation, the dashboard that keeps it live, and the models that frame it.
Then the part most guides skip: the one lever you can move this week to change the result.
Employee engagement ROI is the financial return a company earns from investing in engagement initiatives.
You calculate it by comparing the monetary gains–higher productivity, lower turnover, fewer absences–against the cost of the programs that produced them.
It turns “all engagement ideas matter” into a percentage leadership can act on.
That last part is the whole point. Engagement itself is a feeling. ROI is the translation of that feeling into money, and money is the language budgets are written in.
When you can show that a dollar spent on recognition returns three or four in retained talent and recovered productivity, the program stops being a “nice to have” and starts being a line item that defends itself.
The rest of this guide is about making that translation credible enough to survive a skeptical CFO.
Employee Engagement ROI (%) = [(Monetary Benefits of Engagement − Cost of Engagement Initiatives) ÷ Cost of Engagement Initiatives] × 100
Anything above zero means the program returned more than it cost. Most well-run programs land in the triple digits once you count the full benefit side–which is exactly where teams undersell themselves, because they only count the obvious savings and forget the rest.
The formula is simple. Filling it in honestly is the hard part. So let's do it with real numbers.
Take a 500-person company with an average salary of $70,000 and voluntary turnover running at 20%–100 people walking out the door each year. Here’s how the calculation comes together, step by step.
100 voluntary leavers a year. Assign a replacement cost you can defend–recruiting, onboarding, ramp-up, lost output. A conservative figure is half of annual salary, so $35,000 per leaver.
Engaged teams lose fewer people. Say a recognition program cuts voluntary turnover by 4 points, from 20% to 16%. That's 20 fewer resignations a year. This is deliberately conservative–Gallup's data shows engaged organizations see turnover fall much further than that.
20 retained employees × $35,000 = $700,000 in avoided turnover cost. Leave productivity and absenteeism gains out of the hard number for now–counting them as unclaimed upside keeps your figure bulletproof.
Platform, rewards budget, and admin time for 500 people–call it $150,000 for the year.
($700,000 − $150,000) ÷ $150,000 × 100 = 367% ROI
That’s a defensible number, built on one lever (turnover), with the softer benefits held in reserve.
Walk into a budget meeting with that math and the assumptions written down, and you’re no longer arguing about morale. You’re arguing about a 3.6x return–and you’ve left yourself room to prove more.
The reason most HR teams can’t build this is that the inputs live in five different places: turnover in the HRIS, absenteeism in a spreadsheet, recognition activity nowhere at all.
When those numbers sit in one platform, the calculation stops being a guess.
Stadium’s Automation Dashboard pulls turnover by team, recognition participation, and reward redemption into one view, so the figures you plug into the formula are real, not estimated. And the same model scales cleanly–from a 30-person team to a 10,000-person enterprise.
Get the inputs wrong and a sharp CFO will unravel your whole case. Keep the two sides clean.
You might expect the link between engagement and money to be fuzzy. It isn't. It's one of the most heavily studied relationships in workforce research, and the direction is always the same.
Gallup's Q12 meta-analysis–built on decades of data across thousands of business units–found that teams in the top quartile of engagement are 23% more profitable and 18% more productive in sales than teams in the bottom quartile. They also run 78% lower absenteeism and 21% to 51% lower turnover, depending on the industry. Those aren't morale metrics. Profit, productivity, absence, and turnover are P&L lines, and engagement moves all four in the same direction.
Then there's the cost of standing still, which is where the argument really lands with finance. Doing nothing is not free. McKinsey estimates that disengagement and attrition can cost a median-size S&P 500 company between $228 million and $355 million a year in lost productivity. Zoom out and the global figure is that $8.8 trillion drag–about 9% of GDP. The status quo has a price tag; most companies just never put it on a slide.
Put the two halves together and the business case writes itself. High engagement adds measurable profit and retention. Low engagement quietly subtracts it. The only question left is which lever moves the number fastest–and that's what the rest of this guide is about.
There’s no shortage of engagement metrics to track, and we cover the full set–definitions, formulas, and how to gather each one–in our guide on how to measure employee engagement. This section does something narrower and more useful for a budget case: it sorts the metrics by the job they do inside the ROI formula. Not “what is eNPS,” but which side of the equation each number sits on, and why.
Once you look at KPIs that way, they fall into three roles.
These are the metrics that become the dollars on the top line of your calculation.
Benefit-side metrics confirm the return after it happens. Leading indicators give you warning while you can still act.
The takeaway isn’t “track all of these.” It’s to pick a couple from each role–one benefit-side lever, one leading indicator–so you can both prove the return and see it coming. For how to actually measure and gather each metric, the how-to-measure guide is the companion piece; this one is only about which numbers earn a place in the ROI case.
Search “employee engagement dashboard” and you’ll get a pile of chart templates. Pretty visuals, no guidance on what to actually put in them. That’s backwards. A dashboard isn’t a design exercise–it’s your ROI inputs in one live view, updated often enough to act on.
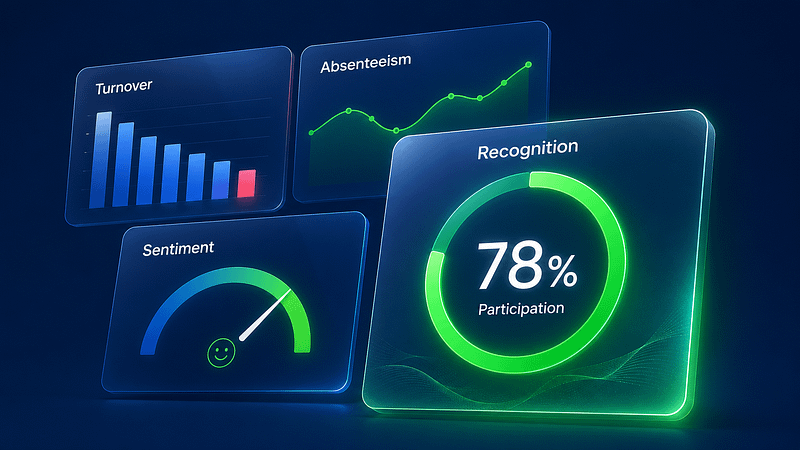
Build it around the four panels that map to the formula.
The placement matters as much as the panels. Put your leading indicators–pulse, participation–where you’ll see them first, because they give you time to act.
Push the lagging indicators–turnover, absenteeism–into the confirming role they play.
A dashboard built this way predicts; a dashboard built as a rear-view mirror only reports.
Here’s where most setups stall: half the inputs are live and half are stale.
Survey data gets exported to a BI tool once a quarter and is out of date by the time anyone opens it.
Recognition data usually isn’t captured at all.
Stadium closes that gap because recognition and redemption happen inside the platform–so participation, activity, and reward data by team and region update themselves in the Automation Dashboard and Shop Dashboard.
That’s the live half of the ROI picture, the half spreadsheets can’t keep current.
Before you spend a dollar, it helps to know which lever you’re pulling. That’s what an engagement model does–it names the drivers of engagement so your investment targets a real cause instead of spraying budget at symptoms. You don’t need to adopt one wholesale. You need to know what each one tells you to fund.
Twelve questions measuring the conditions that drive engagement, from "I know what's expected of me" to whether you've received recognition in the last seven days. That recognition item is telling: Gallup measures it on a weekly cadence because that's how often it needs to happen.
What it tells you to fund: recognition frequency, as a core input, not an annual event.
Frames engagement as three observable behaviors–employees speak well of the company (Say), intend to stay (Stay), and give discretionary effort (Strive).
What it tells you to fund: the three outcomes that feed turnover and productivity straight into your ROI model.
Twelve questions measuring the conditions that drive engagement, from "I know what's expected of me" to whether you've received recognition in the last seven days. That recognition item is telling: Gallup measures it on a weekly cadence because that's how often it needs to happen.
What it tells you to fund: recognition frequency, as a core input, not an annual event.
The original academic framework, from William Kahn in 1990. It identifies three psychological conditions for engagement: meaning, safety, and availability.
What it tells you to fund: the conditions–including recognition and psychological safety–that make people willing to give discretionary effort.
Engagement rises when the resources of a job (support, autonomy, recognition) outweigh its demands. When demands win, you get burnout.
What it tells you to fund: recognition and support as resources that offset the demand side and lower the cost of burnout.
Maslow's hierarchy mapped onto the workplace, with appreciation sitting in the esteem layer above basic pay and security.
What it tells you to fund: recognition as the esteem-level need that basic compensation alone never satisfies.
Everything above gets harder the moment your workforce spans countries and time zones.
Measurement drifts–surveys land at odd hours, language differences skew how questions are read, and response rates sag when people feel far from the center.
You end up comparing a fully-answered survey in one region against a half-empty one in another.
But measuring is only half the problem. Acting on what you find is where global recognition usually dies.
Your data says a team across three countries feels underappreciated, so you send a reward–and it runs straight into customs forms, import fees, and a six-week delivery window.
A gift that arrives late with a duty charge doesn’t read as recognition. It reads as an afterthought. Plenty of good intentions die at a border, and every one of them is ROI you paid for and didn’t collect.
This is where the ability to act locally becomes the entire game. Recognition only counts toward ROI if the reward actually lands.
Stadium measures recognition activity by region and fulfills the reward locally–in 170+ countries, through 500+ warehouses, with recipients choosing what they want via MagicLink™.
Whether you’re recognizing one person or scaling from 1 to 1,000+, the moment lands as fast in Bogotá as it does down the hall.
That’s what makes global engagement ROI real instead of theoretical.
From thoughtful employee onboarding gifts to local fulfillment globally, we make it easy to recognize your team, wherever they are.