









Stadium for Employee Engagement
How to measure employee engagement–the exact metrics, methods, and benchmarks HR leaders use, plus how to turn the data into recognition that moves the number.
Most engagement surveys measure something once a year, then sit in a folder.
The number moves a point or two, nobody knows why, and by the time anyone opens the report again it is time to run the next one.
That gap is expensive. Disengagement rarely announces itself.
It shows up quietly–as turnover, as absenteeism, as a team that hits its deadlines but stops volunteering ideas–months before anyone connects it to the survey data gathering dust.
Measuring employee engagement well is not about collecting a prettier number.
It is about seeing where energy and appreciation are running low so you can do something before people leave.
This guide walks through the exact metrics to track, the methods to gather them, how to benchmark honestly, and the part most guides skip entirely: how to turn engagement data into recognition people actually feel.

Employee engagement is the emotional commitment a person feels to their work, their team, and the organization’s goals – commitment that shows up as discretionary effort, initiative, and the decision to stay.
It’s not a mood or a perk; it’s the difference between someone who does the job and someone who cares how the job turns out.
For an HR leader, engagement is the lever that quietly moves retention, productivity, and culture.
It’s easy to confuse engagement with satisfaction, but they’re not the same thing.
A satisfied employee is content – the pay is fair, the commute is fine, the coffee is decent.
An engaged employee is invested – they bring ideas to the meeting, they help the new hire, they flag the problem before it becomes a fire.
You can be perfectly satisfied and completely checked out, which is exactly why free snacks and a foosball table rarely move performance on their own.
The other thing worth naming: engagement is built year-round, through unique ideas, everyday moments and milestones, not at one annual party.
People don’t feel invested because of a single event in March.
They feel invested when they’re recognized for real work in the moment, when their work anniversary doesn’t get missed, and when the good ideas on this list actually reach them.
That’s the thread running through everything below.
Recognition is the highest-leverage engagement habit most teams under-use.
It’s cheaper than a new benefit, faster than a culture overhaul, and it works every time a person feels seen for their work.
The catch is that recognition only moves engagement when it’s frequent, specific, peer-driven, and tied to a reward the recipient actually wants – not one generic award handed out once a year.
That last part matters more than it sounds. The reason this section is the heart of the article is that most engagement lists name “recognition programs” and “spot awards” as bullet points, then move on – with no way to deliver the reward across a distributed team.
One thing worth internalizing before the ideas: a reward means far more when the recipient chooses it.
The same $50 lands completely differently as a jacket nobody asked for versus a gift the person picked themselves.
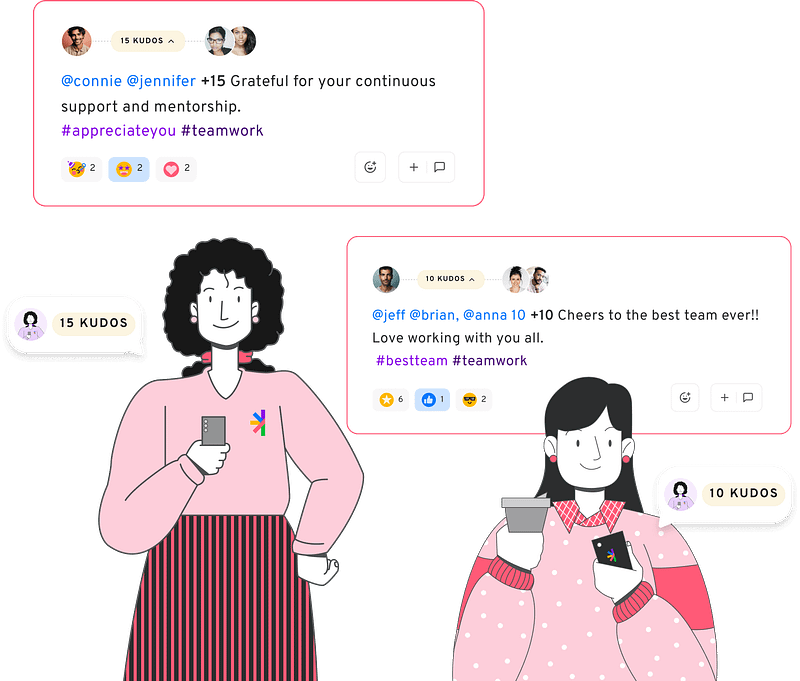
Stand up a recognition program where anyone can recognize anyone, in the moment, tied to points the recipient can redeem.
The magic is in the peers: your managers miss half the great work on a team, but the person sitting next to it doesn’t.
Give everyone a monthly or quarterly allowance of points to send, and make sending praise a two-click action rather than a form.
Rename the currency to something branded so it feels like yours – Keyfactor’s “KEYkudos” is a good template. Set a cadence expectation, too: weekly beats quarterly, because recognition that arrives close to the work reinforces it.
“A kudos program with Stadium Points handles the sending, tracking, and redemption in one place, so recognition doesn’t depend on someone remembering to post in a channel. Once it’s live, praise stops being an occasional event and becomes a habit the whole team owns.”
Attach every recognition to a specific company value so praise reinforces the behavior you want more of. Instead of a generic "great job," a teammate tags a shoutout with #CustomerObsessed or #OwnsTheOutcome – and suddenly the recognition is teaching the whole team what "good" looks like, not just making one person feel nice.
The mechanic is simple: add your values as selectable hashtags inside the recognition program, the way Keyfactor did. Now every piece of praise doubles as a small, public lesson in culture.
Over a quarter, you can even see which values get recognized most and which are going quiet – a surprisingly honest read on how the team actually operates. Vague praise flatters the individual; values-linked praise shapes the group. It costs nothing extra and makes every shoutout do two jobs at once.
Replace the one-size-fits-all award with a shop where the recipient picks their own reward – swag, a gift card, a snack box, or an experience.
The reason is blunt: the same branded fleece lands flat because half the team doesn't want a fleece.
Choice is what turns a reward into something personal, and personal is what people remember.
In practice, you fund a budget or a points amount and the recipient chooses from the catalog, then it's fulfilled locally – they pick it, it ships from a nearby warehouse, done.
Stadium Shops put a 25,000+ product catalog behind each reward, and MagicLink™ covers the case where you don't have someone's shipping address – the recipient just adds their own.
For a distributed team, this is the difference between "we sent everyone a mug" and "everyone got something they actually use."
Set milestone gifting up once and let it run, so no anniversary ever gets missed. A missed three-year anniversary doesn't read as "HR is busy" – it reads as "they don't care."
And when you're a people team of one tracking a scattered workforce, missing them is almost guaranteed if it depends on memory and a spreadsheet.
Configure the milestones from three-year through 25-year, with the points amount scaling up as tenure grows, then connect it to your HRIS so the trigger fires on the actual anniversary date.
The Automation Dashboard handles the timing and delivery; the employee gets points to a shop on the right day, every year, without anyone lifting a finger. You do the thinking once. After that, consistency stops being a task you can fail at.
Trigger a branded swag kit the moment a new hire lands in your HRIS, so day one feels considered instead of chaotic. First impressions compound – a hire who unboxes a thoughtful kit before their first standup starts the job feeling like the company was ready for them. A hire whose "welcome swag" shows up six weeks late gets the opposite message.
Add fun, non-performance award categories that peers vote on, alongside your standard monthly standout. Traditional Employee of the Month goes stale fast and tends to reward the same three high-visibility people – meanwhile the person who quietly unblocks everyone never gets a mention. Categories like "Best Teammate" or "Calmest in a Crisis" spread recognition to the behaviors that hold a team together but never show up on a dashboard.
Let managers send a small, instant reward the moment they catch great work – a snack box or a handful of points, same day. Recognition has a short shelf life. A thank-you that arrives two weeks after the late-night launch save has lost most of its punch; the win and the acknowledgment should sit close together in time.
Give managers a standing budget or points balance and a fast way to send – Quick Recognize lets them recognize someone in under 30 seconds, so there's no friction between the impulse and the action. Pair it with a snack box from Snackmagic or Stadium Points the person can bank toward something bigger. The goal is speed: make it so easy to say "that was excellent, here's a little something" that managers do it in the moment instead of meaning to later.
Metrics tell you what to watch. Methods are how you gather them. No single method gives you the whole picture–surveys tell you what people think, conversations tell you why, and behavioral data tells you what they actually do. The strongest programs combine all three. Here are eight methods and when to use each.
The comprehensive baseline. A well-built annual survey runs 30 to 50 questions across the main drivers–purpose, growth, management, recognition, and confidence in leadership–and gives you a full-workforce read you can compare year over year. Best for setting your benchmark and spotting big-picture shifts. Its weakness is frequency; a lot can change in twelve months. Make recognition one of the dimensions you measure, not an afterthought.
Short, frequent surveys–three to five questions, monthly or quarterly–built to catch movement the annual survey misses. Best for real-time trends and for testing whether a change you made actually worked. Pair them with the annual survey rather than replacing it: the annual gives you depth, the pulse gives you speed.
The one-question advocacy read. Fast to run, high response rates, and easy to trend over time. Best for a quick, regular temperature check you can segment by team or manager to see where advocacy is strong and where it is thin. Keep the follow-up “why” open-ended–that is where the reason behind the score shows up.
A proactive one-on-one with an employee you want to keep, built around two questions: what makes you stay, and what might tempt you to leave? Best for catching risk while you can still act on it–the preemptive alternative to the exit interview. Stay interviews surface fixable problems, and one of the most common is some version of “I do not feel like my work gets noticed.” That is a finding you can act on this week.
Feedback from people on their way out. Departing employees are often more candid than current ones, which makes exit interviews useful for spotting recurring themes–a manager several people quietly cite, a pay band slipping behind the market. The limitation is that it is a lagging method: you are learning why someone left, not preventing it. Look for patterns across many exits, not lessons from any single one.
The most underrated source of engagement data, because it is already on the calendar. Regular manager-employee one-on-ones are a continuous read on how someone is doing–if you know what to listen for. Engaged employees talk about the future, ask about growth, and bring problems forward. Disengaged ones go quiet, keep it strictly transactional, and stop offering opinions. Managers who log these signals catch disengagement long before a survey does.
A small-group conversation–six to ten people–to explain the why behind a survey trend. Best for digging into a number you do not understand, like a sudden drop in one department. Focus groups need a skilled, neutral facilitator and genuine psychological safety; if people think their answers will get back to their manager, you will get silence or spin. Done well, they turn a confusing data point into a clear story.
The objective, always-on signal–and the bridge from asking people to observing them. Instead of relying on self-report, you watch what people actually do: participation in optional activities, collaboration across teams, and, tellingly, recognition activity. When discretionary participation quietly declines, disengagement is often already underway weeks before a survey catches it. Recognition data is especially readable–a recognition program run on Stadium surfaces who is giving and receiving recognition by team through the Feed and Automation Dashboard, so you get a live engagement signal instead of waiting for the next quarterly guess.
There is no universal “good” engagement score.
A number that is excellent in one industry is mediocre in another, and the absolute figure matters far less than the direction it is moving.
A team climbing from 55% to 65% favorable is a better story than one holding flat at 70%. Context and trend beat the headline number every time.
That is worth sitting with, because it is easy to do benchmarking backwards.
Benchmarking means comparing your results against a reference point–either external norms (industry averages) or your own history. Both have a place, but most organizations lean too hard on the external one.
External benchmarks are seductive and often misleading. Industry averages vary less than people assume, they are frequently built on self-selected data, and–worst of all–they hand you an excuse.
“We are at the industry average” feels fine right up until your best people leave for somewhere that was not satisfied with average.
Internal benchmarks are where the real signal is. Compare each team against its own past, and segment by the cuts that actually predict behavior: department, region, tenure, and manager. That is how you find the team that dropped eight points since last quarter–the one an industry average would have hidden completely.
The most useful benchmark of all is often your own recognition participation trend. Are more people being recognized this quarter than last? Stadium’s reporting lets you track that across teams and regions. Set external context once, then compete against yourself.
Every metric and method above is ultimately measuring the same underlying thing: the drivers of engagement. These are the conditions that make people invested–or not. Across the major workplace research, the same short list keeps surfacing.
Two of these deserve a closer look, because that is where a little employee engagement effort returns the most.
Managers matter more than anything else on the list. Gallup found that managers account for 70% of the variance in team engagement (Gallup).
Read that again: the difference between your most and least engaged teams is explained mostly by who is managing them–not pay, not perks, not the mission statement. Which is exactly why manager training and manager-level engagement data are not optional.
Recognition is the driver you can act on fastest.
You cannot rebuild someone’s career path this week or swap out their manager by Friday. But you can make sure they are recognized for good work this week. Gallup’s own Q12–the twelve questions it uses to measure engagement–includes “In the last seven days, I have received recognition or praise for doing good work.”
Seven days. It is measured on a weekly cadence because that is how often it needs to happen.
Pair it with choice–letting people pick a reward they actually want through Stadium Points or a Kudos Program rather than another branded mug–and the recognition lands instead of being forgotten. It is the one driver you can move this week, everywhere you have people.
Everything gets harder when your workforce is spread across countries and living rooms. The visual cues disappear–you cannot read the room when there is no room. Time zones fracture survey timing, language differences skew how questions are understood, and response rates suffer when people feel disconnected from the center.
But measurement is only half the problem. The harder half is acting on what you find. When your data says a team in three countries feels unappreciated, the response–actually recognizing them–runs straight into customs forms, import fees, and returned packages. Plenty of good intentions die at a border. A gift that takes six weeks and arrives with a duty charge does not say “we value you.”
This is where the ability to act globally becomes the whole game.
Stadium measures recognition activity across regions and delivers the reward locally–fulfilled in 170+ countries through 500+ warehouses, with recipients choosing what they want via MagicLink™. Whether you are recognizing one person or ten thousand, from 1 to 1,000+, the response lands as fast locally as it would down the hall.
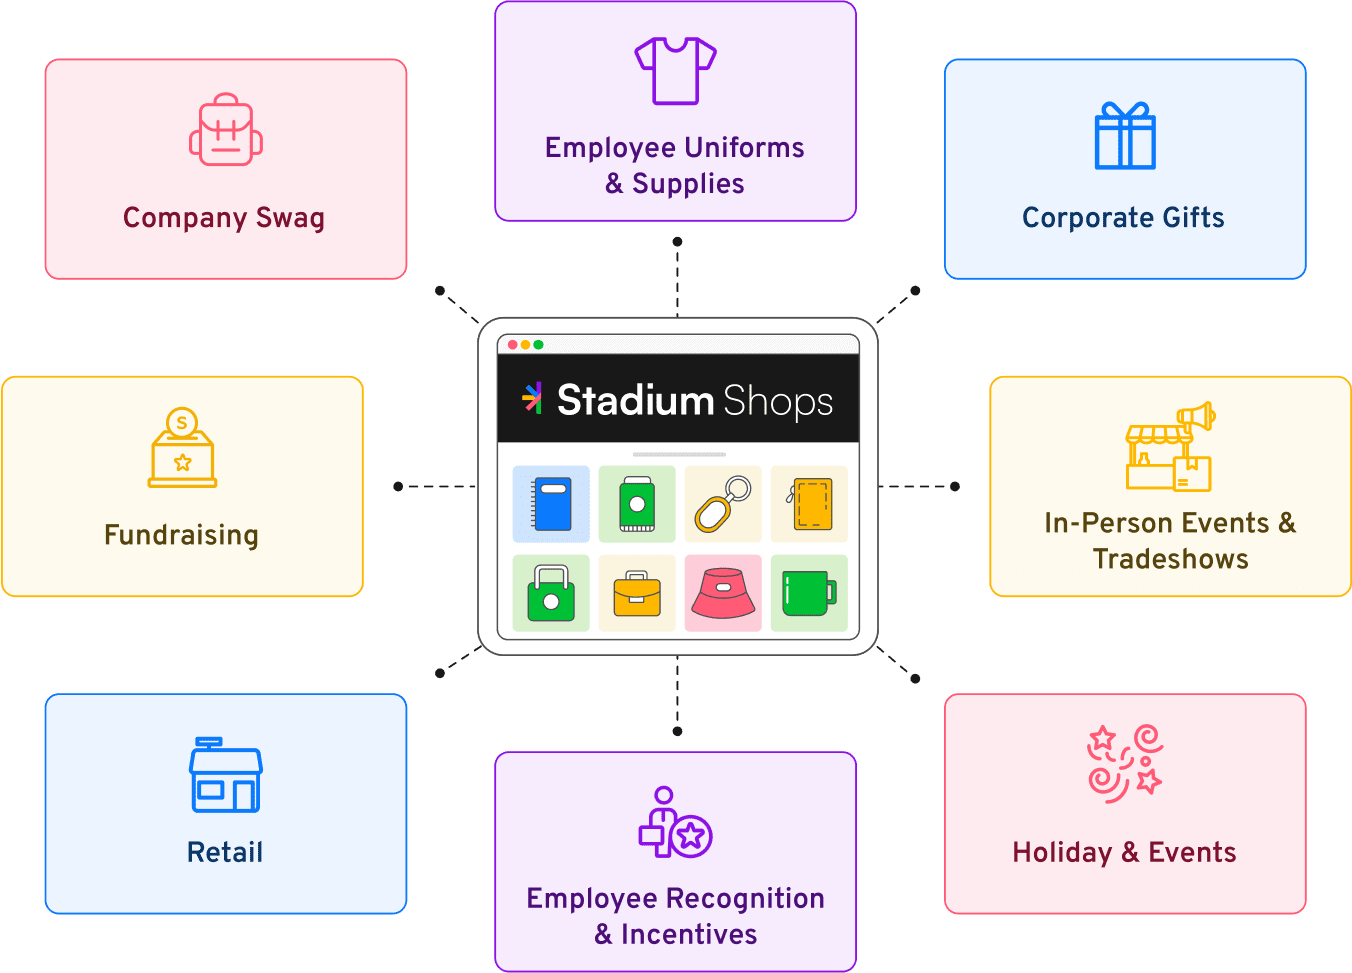
From thoughtful employee onboarding gifts to local fulfillment globally, we make it easy to recognize your team, wherever they are.


