Employee recognition
Employee Recognition Budget: How to Plan It (2026)
Set a recognition budget that survives Q3 cuts. Benchmarks, categories, global math, and a 500-employee worked example–built for HR.


Most recognition budgets are written in November, frozen by February, and quietly raided by July. Not because HR planned wrong–because the budget was one line item built against a recognition program that actually lives in eight different places: service awards, peer-to-peer kudos, manager spot bonuses, onboarding kits, Employee Appreciation Day, milestone gifts, holiday moments, and the surprise that always shows up (a layoff to navigate, a record quarter to celebrate, a region that needs more than the spreadsheet expected).
The macro picture isn’t helping either. Gallup’s 2024 data puts U.S. employee engagement at a 10-year low–31% engaged. More than half the workforce is watching for or actively seeking another role. The recognition budget isn’t a footnote in the rewards plan anymore. It’s a defended line item, and the CFO is going to ask why.
By the end of this piece, you’ll have a defensible number, a category breakdown that doesn’t pretend platforms and taxes are free, a worked example for a 500-employee company, and answers to the questions Finance is about to ask.
Table of Contents
Why an Employee Recognition Budget matters (and why hesitation costs more than the spend)

Underfunded recognition is worse than no recognition. A program that starts strong and runs dry by Q3 doesn’t read as a budgeting accident to employees. It reads as a company that stopped caring. The first round of departures usually follows by Q4.
The cost of that signal isn’t soft. Gallup’s 2024 retention research prices voluntary turnover at roughly 200% of salary for managers and leaders, 80% for technical roles, and 40% for frontline staff. A recognition budget sitting at $300,000 is doing the work of a retention reserve well over $1M. It’s not a culture line item miscategorized. It’s a retention line item miscategorized.
The recognition budget moved from footnote to CFO conversation for reasons that have stacked on top of each other: engagement at a 10-year low, more than half the workforce job-curious, and every dollar of HR spend re-justified line by line. The number you walk into that conversation with has to hold up.
So how much should you actually spend?
How much should you spend on employee recognition? Two benchmarks that actually work
Percentage of total payroll (0.5% to 2%)
SHRM has long endorsed 1% of total annual payroll as the recognition baseline. Practitioner ranges run from 0.5% on the lean end to 2% in high-recognition cultures.
The math is straightforward. A 200-employee company at $70,000 average salary carries $14M in annual payroll. At 1%, that’s a $140,000 recognition budget. At 0.5%, $70,000. At 2%, $280,000. The number covers everything you’ll see in the next section: service awards, peer-to-peer, manager spot recognition, milestones, holidays, and onboarding kits.
A few things push toward the higher end. High voluntary turnover industries like hospitality, healthcare, and retail. Recent organizational change. A globally distributed workforce. Each adds a retention case for spending more.
Per-employee dollar allocation ($100 to $350 per year)
Two anchors most ranking articles cite, and both are real. Recognition Professionals International recommends a baseline of $100 to $150 for performance-based recognition alone. O.C. Tanner Institute’s Global Culture Report recommends $200 to $350 per employee per year for a comprehensive recognition culture–service awards, day-to-day recognition, milestones, onboarding kits, and holiday moments.
Reconcile the gap honestly. The $100 to $150 floor is for one program type. The $200 to $350 ceiling is the total across all program types. Same 200-employee company: at $150 per employee, $30,000 funds a single program; at $300 per employee, $60,000 funds the full mix.
Both methods land at roughly 0.5% to 1% of payroll. That convergence is the sanity check. A per-employee number mapping to 3% of payroll means the program is over-built. Mapping to 0.2% means it won’t survive contact with the year.

Which method fits your company stage
Early stage, under 100 employees. Per-employee dollar wins. Headcount is the only real variable; payroll-percent gives you numbers too small to fund a real program.
Mid-sized, 100 to 1,000 employees. Use both. Payroll-percent for the top-line defense in front of Finance; per-employee for the category-by-category allocation.
Enterprise, 1,000+ employees. Payroll-percent becomes the dominant frame because the program is funded out of total rewards. Per-employee numbers still matter for governance: per-region budgets, per-business-unit budgets, per-manager budgets.
The two should cross-check each other regardless of stage. If they don’t, a category is over- or under-funded. Stadium runs from 1 to 1,000+ on the same platform, so stage transitions don’t force a tool switch.
Essential Financial Components for Recognition Budget Calculation
| Component Name | Meaning | Formula | Purpose |
|---|---|---|---|
| Base Recognition Allocation (BRA) | The foundational per-employee allocation serves as your baseline recognition investment. | BRA = Annual Recognition Budget ÷ Total Headcount | To establish a consistent and equitable per-employee recognition budget that forms the foundation for all recognition-related financial planning. |
| Recognition-to-Compensation Ratio (RCR) | This ratio compares your recognition investment against your total compensation expenditure. | RCR = (Total Recognition Budget ÷ Total Compensation Budget) × 100 | To evaluate recognition spending as a percentage of total compensation, helping organizations benchmark and ensure budget efficiency relative to payroll. |
| Recognition Return on Investment (RROI) | This measures the financial benefit derived from recognition investments. | RROI = [(Financial Benefit from Recognition − Recognition Cost) ÷ Recognition Cost] × 100 | To measure the effectiveness of recognition spend by quantifying the financial returns, guiding better budgeting decisions and ROI-focused program design. |
| Employee Lifetime Value (ELV) | Calculates the total net value an employee brings throughout their tenure. | ELV = (Average Annual Revenue per Employee × Average Tenure) − (Hiring Costs + Total Compensation + Training Costs) | To assess long-term employee contribution against cost, enabling HR and finance teams to justify recognition investment as a driver of increased retention and value. |
| Recognition Elasticity Coefficient (REC) | Measures how engagement metrics change relative to recognition investment changes. | REC = % Change in Engagement Metrics ÷ % Change in Recognition Investment | To determine how changes in recognition spending affect employee engagement, allowing budget planners to adjust allocations for maximum impact. |
Strategic Budgeting Process: A Quantitative Approach
This process transforms employee recognition from a simple expense into a strategic investment with measurable financial returns.
To better understand each component, we will walk through a real-time case study using a fictional company named ABC. While ABC is not a real organization, it serves as a continuous example to illustrate how each step of the recognition budgeting process can be applied effectively.
Company Overview:
Company Name: ABC
Number of Employees: 500
Here’s a detailed breakdown:
Step 1: Establish Financial Parameters and Recognition Objectives
In this crucial first step, ABC Corporation (500 employees) quantified exactly how recognition impacts their bottom line:
Their financial team conducted a thorough cost analysis of turnover:
- They calculated that each employee departure costs approximately $45,000 when accounting for recruiting fees, training investments, and lost productivity during transitions
- With 75 employees (15% of workforce) leaving annually, turnover was costing them $3,375,000 per year
The company then set specific financial targets tied to recognition:
- A 5% reduction in turnover would save $1,125,000 annually
- Productivity improvements of 3% would generate $750,000 in additional value
- Reducing absenteeism by 10% would contribute $225,000 in savings
This financial mapping exercise involved multiple stakeholders working together:
- The CFO validated financial models to ensure projections were realistic
- HR provided critical turnover statistics and employee engagement data
- Department leaders contributed insights on how recognition impacts productivity
- Financial analysts built comprehensive ROI models to track program effectiveness
Step 2: Calculate Total Budget Parameters Using Industry-Standard Formulas
ABC Corporation used the Recognition-to-Compensation Ratio (RCR) formula to develop three potential budget scenarios:
Conservative (1% RCR):
- With total compensation at $32.5 million, this yielded a $325,000 recognition budget
- This equated to $650 per employee annually for recognition activities
Moderate (1.5% RCR):
- This approach allocated $487,500 to recognition
- Per-employee investment increased to $975 annually
Aggressive (2% RCR):
- The highest investment level reached $650,000
- This provided $1,300 per employee annually for recognition initiatives
After analyzing potential returns through detailed financial modeling, ABC selected the moderate approach, which projected:
- A 330% ROI, calculated precisely using the formula: [(2,100,000 – 487,500) ÷ 487,500 × 100]
- This exceptional return justified the investment to financial stakeholders
Step 3: Develop a Tiered Recognition Framework with Precise Allocations
ABC Corporation used the Recognition-to-Compensation Ratio (RCR) formula to develop three potential budget scenarios:
Conservative (1% RCR):
- With total compensation at $32.5 million, this yielded a $325,000 recognition budget
- This equated to $650 per employee annually for recognition activities
Moderate (1.5% RCR):
- This approach allocated $487,500 to recognition
- Per-employee investment increased to $975 annually
Aggressive (2% RCR):
- The highest investment level reached $650,000
- This provided $1,300 per employee annually for recognition initiatives
After analyzing potential returns through detailed financial modeling, ABC selected the moderate approach, which projected:
- A 330% ROI, calculated precisely using the formula: [(2,100,000 – 487,500) ÷ 487,500 × 100]
- This exceptional return justified the investment to financial stakeholders
ABC Corporation created a structured allocation system dividing its $487,500 budget into five distinct tiers:
Tier 1: Peer-to-Peer Recognition (20%)
- $97,500 dedicated to peer recognition
- Each recognition instance is valued between $25-50
- Annual allocation of $195 per employee for peer recognition
- Implemented through a points-based platform allowing employees to redeem rewards
Tier 2: Manager Discretionary Recognition (15%)
- $73,125 allocated for manager-distributed recognition
- Recognition values ranged from $50-200 per instance
- Each manager received approximately $2,925 annually to recognize their team members
- Primarily distributed through digital gift cards and experience-based rewards
Tier 3: Milestone Recognition (30%)
- $146,250 (the largest allocation) focused on significant achievements
- Service anniversaries followed a progressive scale from $100 (first year) to $1,000+ (15+ years)
- Skill certifications received standardized recognition of $150
- Project completions were recognized at $200-500 based on complexity and impact
Tier 4: Business Unit Recognition (15%)
- $73,125 distributed to business units based on performance
- Units received allocations calculated by: (Unit Headcount ÷ 500) × Performance Multiplier × $73,125
- Performance multipliers ranged from 0.8 (underperforming) to 1.5 (exceptional)
Tier 5: Company-Wide Recognition (20%)
- $97,500 dedicated to broader recognition initiatives
- Quarterly recognition events received $40,000 ($20 per employee quarterly)
- Annual celebration allocated $57,500 ($115 per employee)
Step 4: Implement Financial Controls and Recognition Distribution Systems
ABC Corporation established precise financial controls to manage their recognition investment:
Budget Distribution Schedule:
- 60% ($292,500) allocated annually for planned recognition
- 40% ($195,000) distributed quarterly ($48,750 per quarter) for responsive recognition
Authorization Hierarchy:
- Peer recognition required no approval but had system-enforced budget constraints
- Manager recognition up to $100 had no approval requirements
- Recognition between $101-250 required director approval
- Department-level recognition requires department head authorization with monthly financial reconciliation
- Company-wide initiatives required executive committee review and approval
Financial Monitoring System:
- A real-time dashboard tracked key metrics:
- Budget utilization by department (targeting 90-100% utilization)
- Recognition equity across departments (aiming for less than 15% variance)
- Continuous ROI calculation updated quarterly
Step 5: Establish a Quantitative Measurement Framework
ABC Corporation implemented a comprehensive measurement system:
Financial Performance Metrics:
- Recognition Return on Investment (RROI) calculated every quarter
- Employee Lifetime Value (ELV) is reassessed twice yearly
- Cost-per-Engagement Point tracked monthly to ensure efficient spending
Engagement Performance Indicators:
- Platform utilization targets set at 80%+ employee participation
- Statistical correlation analysis between recognition and turnover
- Engagement scores tracked with a minimum 5% annual improvement target
Operational Performance Measures:
- Revenue-per-employee analyzed against recognition frequency
- Error rates measured against recognition distribution patterns
- Innovation submissions correlated with recognition levels by department
Step 6: Execute Budget Adjustment Protocol Based on Financial Performance
ABC Corporation established data-driven triggers for budget adjustments:
Increase Triggers:
- RROI exceeding 200% triggered consideration of 10-15% budget increases
- Turnover decreases beyond 5% resulted in reinvestment of 25% of the savings
- Production improvements exceeding 7% led to the allocation of 10% of the gained value
Redistribution Triggers:
- Utilization below 70% in any tier triggered 15-20% reallocation to higher-performing tiers
- Department distribution variances exceeding 20% activated corrective allocation formulas
- Recognition types with superior ROI received 10-15% additional funding
Reduction Triggers:
- RROI falling below 150% triggered analysis of underperforming components
- Company financial performance declines shifted focus toward non-monetary recognition
- Utilization below 60% triggered program reassessment before additional investment
This comprehensive framework transformed ABC Corporation’s recognition program from a simple expense into a strategic investment with clear financial parameters, precise allocations, and data-driven decision protocols.
Budget Allocations for Comprehensive Recognition Programs
A properly structured recognition budget should encompass multiple recognition touchpoints throughout the employee lifecycle:
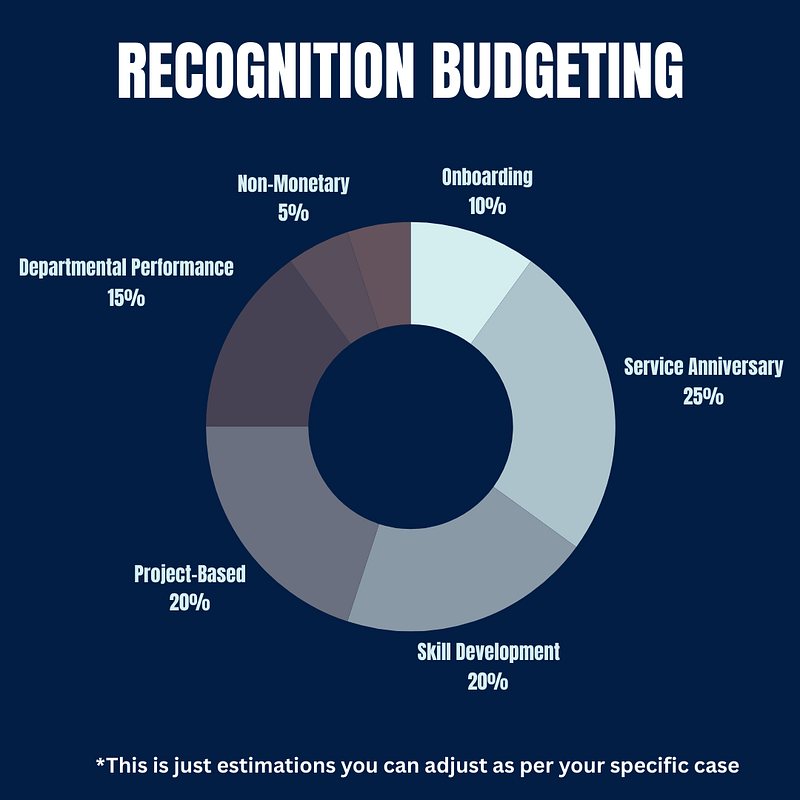
1. Onboarding Recognition Allocation (10-15% of total budget)
Financial resources dedicated to welcoming and integrating new team members.
Implementation examples:
- Welcome kits ($50-100 per new hire)
- First achievement recognitions ($25-50 per milestone)
- Early integration celebrations ($75-150 per quarter per new hire)
2. Service Anniversary Investment (25-30% of total budget)
Systematically recognizing tenure milestones with scaled rewards.
Financial scaling recommendation:
- 1 Year: $100-200 per employee
- 3 Years: $200-350 per employee
- 5 Years: $350-500 per employee
- 10 Years: $500-1,000 per employee
- 15+ Years: $1,000+ per employee
3. Skill Development Recognition (15-20% of total budget)
Rewards for certification completion, skill acquisition, and knowledge expansion.
Calculation approach:
- Certificate/Course Completion: $50-150 per achievement
- Skill Application Demonstration: $75-200 per implementation
- Knowledge Transfer Activities: $100-250 per documentation/training session
4. Project-Based Recognition (15-20% of total budget)
Financial allocations for extraordinary performance on special initiatives.
Tiered investment structure:
- Project Contribution Recognition: $50-150 per instance
- Project Milestone Achievement: $100-300 per significant milestone
- Project Completion Excellence: $200-500 for exceptional outcomes
5. Departmental Performance Allocation (10-15% of total budget)
Funds are distributed to business units based on performance metrics.
Formula: Department Allocation = (Department Headcount ÷ Total Employee Count) × Departmental Performance Multiplier × Total Allocated Budget
Departmental Performance Multiplier: 0.8 (below target) to 1.5 (exceptional performance)
6. Non-Monetary Recognition Systems (5-10% of total budget)
Infrastructure investments for recognition delivery that don’t involve direct financial rewards.
Example allocations:
- Recognition platform licensing: $5-15 per employee monthly
- Internal communications campaigns: $1,000-5,000 annually
- Recognition training for managers: $200-500 per manager annually
7. Seasonal and Holiday Recognition (5-10% of total budget)
Planned expenditures for industry holidays and year-end recognition events.
Common allocations:
- Industry-specific recognition days: $25-50 per employee
- Year-end recognition events: $75-150 per employee
- Holiday Appreciation: $50-100 per employee
What to include in the budget: eight line items most plans miss
A complete recognition budget runs across eight line items. Most plans cover six. The two competitors skip–platform infrastructure and tax–are the ones that quietly kill the program when they’re missing.
1. Service awards and tenure milestones
Service awards anchor the budget because the moments are predictable. Rule of thumb: about $20 per year of service. A 5-year milestone runs $100, a 10-year $200, a 25-year $500.
The modern shift is recognizing earlier. 1-year and 3-year milestones are now standard, because early job-hopping is where most turnover actually happens. Stadium’s Automation Dashboard fires milestone recognition the day the anniversary hits, so the list never has to be tracked by hand.
2. Peer-to-peer recognition (the engine of frequency)
Peer-to-peer pays back most for the least, because it generates the frequency manager-led recognition can’t match. Budget: $15 to $30 per employee per year for points or gift value, plus the platform that enables the exchange.
The redemption sweet spot sits around $15 to $25. That’s where most employees actually trade points for a gift instead of letting them expire. One semantic note worth getting right: the recognition program is the umbrella; peer kudos is the specific employee-to-employee exchange that lives inside it.
3. Manager-led above-and-beyond recognition
The forgotten middle. Peer recognition handles frequency; service awards handle milestones. What’s left is the manager who watches an employee carry a launch over the line and needs to recognize it that week, not at the next review cycle.
Rule of thumb: 10 manager-led recognitions per direct report per year at $25 to $75 each. A 300-person company with 30 managers budgets roughly $22,500 to $67,500. It’s the most predictive line item for whether managers actually use the program. No budget, no recognition–and the program quietly fades from the middle of the org.
4. Onboarding and the first 90 days
The line item most plans mention and rarely budget honestly. Build in a welcome kit that arrives at the new hire’s home before day one, a 30-day check-in, and a 90-day milestone. Per-hire range: $75 to $200.
The business case is the cleanest in HR. A $150 welcome kit against a $30,000 replacement cost. With local fulfillment in 170+ countries, the remote hire receives the kit on day one the same way the on-site team does.
5. Employee Appreciation Day and industry holidays
Employee Appreciation Day–the first Friday of March–is the single biggest planned recognition moment of the year. Budget: $50 to $150 per employee for the day. Curated snack box, swag drop, or a gift card the employee chooses. Industry holidays layer on top: Nurses Week, Teacher Appreciation Week, Admin Professionals Day.
This is where the global gap shows up. Employee Appreciation Day is U.S.-centric. Build an equivalent in regional context for distributed teams, or pick a company-wide appreciation moment that translates everywhere.
6. Wellness, life moments, and surprise recognition
The line item most budgets forget. New baby. Wedding. Sympathy. The team that pulled an all-nighter to ship.
Rule of thumb: hold back 10 to 15% of total budget for opportunistic moments. This is the “use it or lose it” pool, and it builds the most loyalty per dollar precisely because the gift is unplanned. It’s also the budget that lets a manager say yes when they ping HR at 4pm Friday about something for the launch.
7. Technology and platform infrastructure
The line competitors skip or footnote. The platform isn’t overhead–it’s the engine that decides whether the other seven categories actually fire. Budget guidance: 20 to 30% of total spend for license, integrations, automation, and admin time.
Cut this line and the program defaults to manual triggers. Six months later it’s dead because the friction is too high. The 20 to 30% is what makes the other 70 to 80% of the budget actually reach the employee.
8. Tax, customs, and admin overhead
The line where U.S.-only articles fall apart. In the U.S., most recognition gifts are taxable income unless they qualify under the de minimis or service award exceptions. Best practice grosses up the taxable portion so the employee receives the full value–plan for 25 to 35% on top. (Rules shift; consult your tax advisor before you publish the final number.)
Globally, customs duty on physical gifts moving across a U.S. border can exceed the gift’s value. Local fulfillment removes the customs line by design.
Why Employee Recognition Programs Are Worth the Investment
Implementing a structured employee recognition program isn’t just a feel-good move—it’s a smart business strategy. When appreciation becomes part of everyday work culture, it boosts morale, engagement, and retention.
Recognition doesn’t have to be elaborate or costly; what truly matters is being sincere, specific, and consistent. When employees know their extra efforts are noticed, they’re more likely to stay motivated and committed.
Even a simple “thank you” can go a long way in creating a workplace where people feel valued.
Start small if needed, but commit. A well-executed recognition program can transform your culture and significantly impact your team’s performance—and your bottom line will reflect that change.
- Peer-to-peer, senior-to-junior, and vice versa
- Assign monetary value to kudos or keep them free
- Integrate with Teams, Slack, or use our platform
- 1M+ gifts from top brands + customizable swag
- Enable kudos to flow freely across your org chart
Are you ready
to take recognition to a whole new level?